Doing Analysis in Coursework
The idea behind analysis is to take data which you have collected and try to interpret what it tells you. The best way to do this is to take a graph(s) so that the data is presented, describe what the graph shows and then attempt to give reasons as to why the graph shows what it does. In this latter part you might refer to theory or process, for example, longshore drift.
Example
The Impact of Longshore Drift on Beach Profiles
Figure 8 Beach Transect 1
Figure 8 shows the beach profile of three transects which are shown on the map in the introduction. {puts the transects in context} The profiles are relatively shallow, however, gradient changes at -4 and at 5 metres on Transect 1 inland reflecting the change in slope. Transect 3 shows a build-up of sediment against the groyne giving the profile a slightly convex shape. {description} 
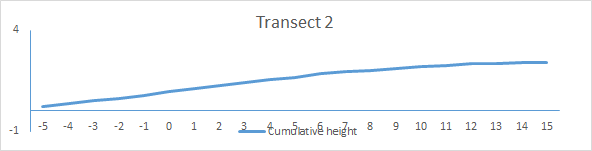

Given the location of the transects along the beach on the up-drift side of the groyne, these profiles are consistent with what would be expected as longshore drift is operating in a north-east to south-west direction on this stretch of beach. At transect 3 the convex shape is a result of sediment becoming trapped by the groyne and this is clearly shown in the photograph below.
