Monday, December 7, 2015
Wednesday, October 28, 2015
Mass Tourism in Europe
Mass Tourism in Europe
Find a city (coastal) in Europe that is WELL KNOWN for mass tourism. (Millions of people).
Check with JM that you can choose it.
On a word document:
Introduction Write an introduction to include a map, description of its location etc
Factfile
Add a factfile - population, climate, geographical features, landscape etc
Mass Tourism
How many tourists visited in in a recent calendar year? E.g. 2014
What was life like there before tourism? When was that?
Negative Aspects
Find out some of the negative aspects of tourism in this city.
Have crime rates risen for example?
Are resources such as water being used at an unsustainable rate? Electricity generation? Space (land)?
What are some other issues such as waste disposal, pollution.
Pollution - noise, light, air, sea, water (fresh)
Do all the local people like what has happened to the area?
What is happening to the local culture?
Chosen so far:
Faliraki, Ayia Napa, Benidorm, Malia, Zante, Kavos, Palma de Majorca, Magaluf
Monday, June 22, 2015
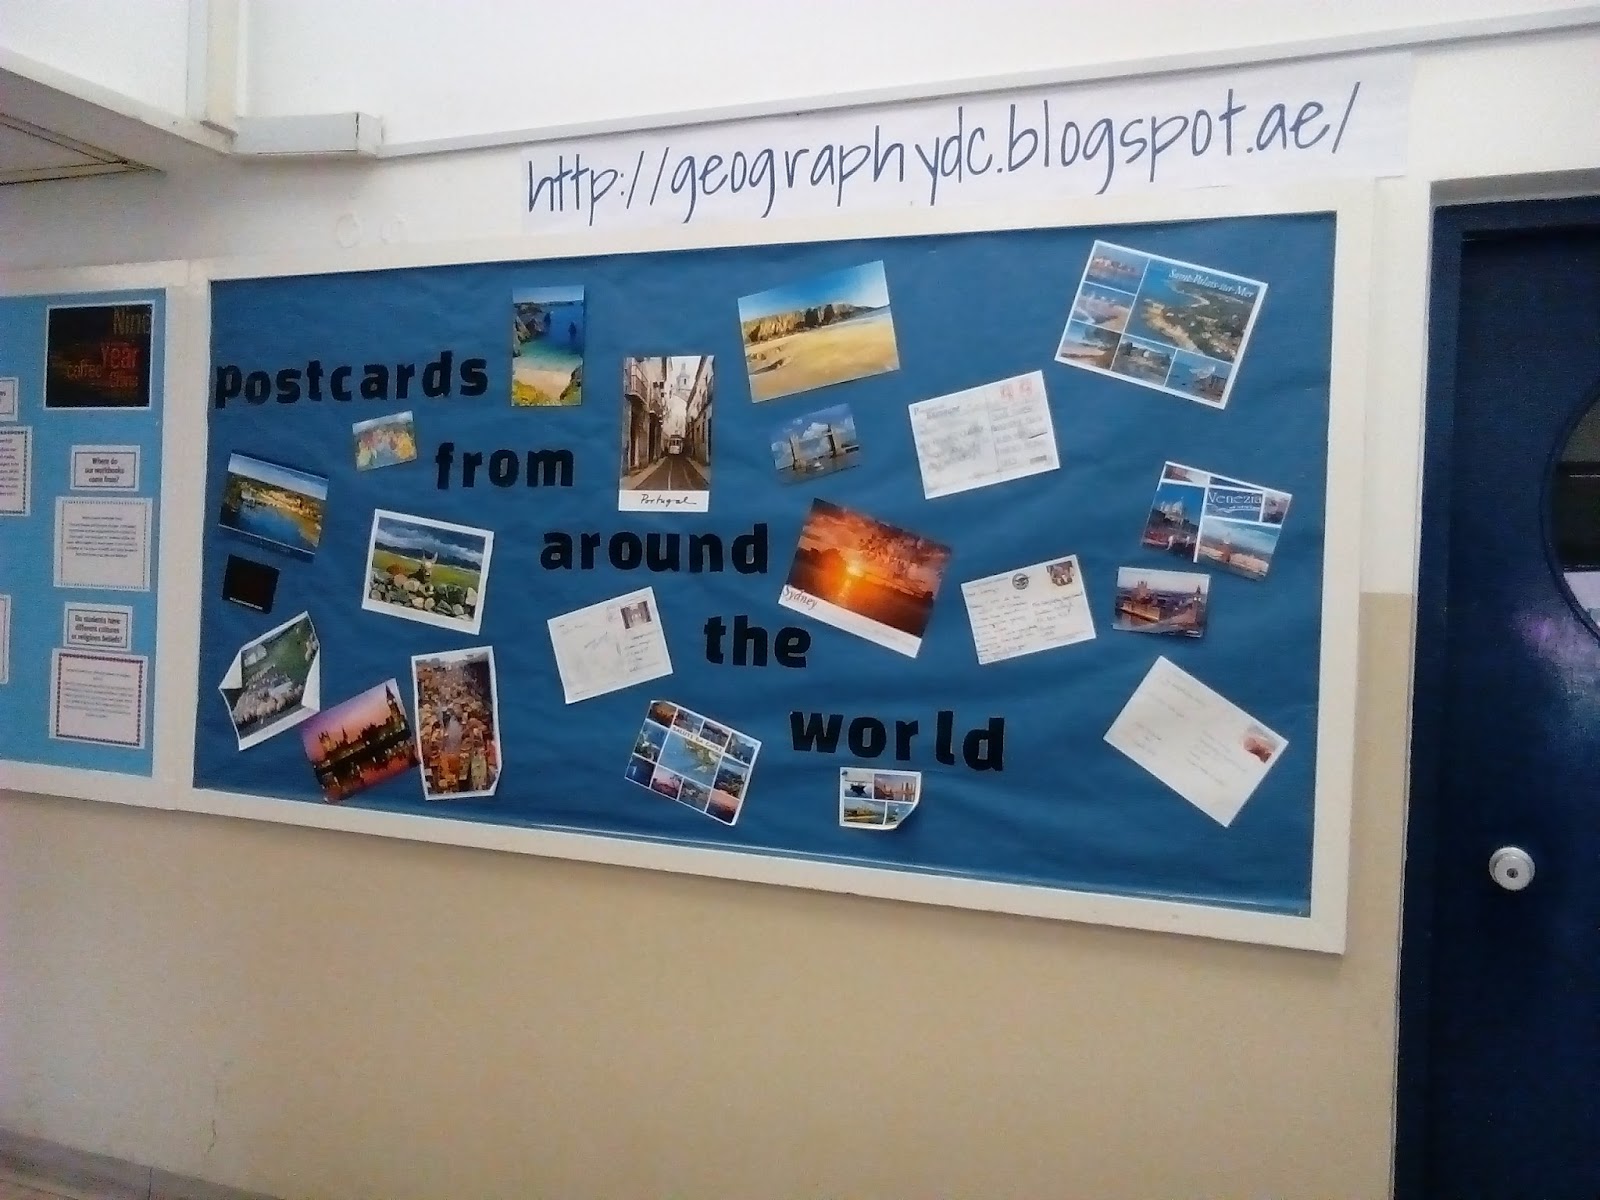
postcards from around the world
- send the Geography Department a postcard
- choose one that is geographical - human or physical
- there are some on the noticeboard in the corridor
- send your card to: The Geography Department, Dubai College, P.O.Box 837, Dubai, United Arab Emirates
Sunday, June 7, 2015
Unit 4B Mock exam
The Unit 4B mock exam will be on Wednesday 10 June 2015 starting at 10.15 and finishing at 11.45.
Tuesday, May 19, 2015
Monday, April 27, 2015
Twitter links for Unit 4B - KENYA
Read and make some notes:
http://www.leriba.com/insights/snapshots/education-and-health-care-in-kenya/
http://www.avert.org/hiv-aids-kenya.htm
http://www.bbc.co.uk/news/world-africa-32341939
http://blogs.worldbank.org/nasikiliza/mosquito-nets-kenya-driving-africa-s-fastest-reduction-infant-mortality
#GEO4B
http://www.leriba.com/insights/snapshots/education-and-health-care-in-kenya/
http://www.avert.org/hiv-aids-kenya.htm
http://www.bbc.co.uk/news/world-africa-32341939
http://blogs.worldbank.org/nasikiliza/mosquito-nets-kenya-driving-africa-s-fastest-reduction-infant-mortality
#GEO4B
Monday, April 20, 2015
Unit 4B - Possible Questions - Ideas etc - Work in Progress
Possible questions ideas etc
https://docs.google.com/document/d/1Zliz_6doLBUFkjUmh3BnD_yP_pQ7WX3JFcC2nfx0PA0/edit?usp=sharing
Graphs etc for GDP vs Life Ex, Infant Mortality over time, Doctor Numbers etc
https://docs.google.com/spreadsheets/d/1Er-leL71oawuGQHRLK_KbyESzwzcPkn4dvwY8Qec1FU/edit?usp=sharing
https://docs.google.com/document/d/1Zliz_6doLBUFkjUmh3BnD_yP_pQ7WX3JFcC2nfx0PA0/edit?usp=sharing
Graphs etc for GDP vs Life Ex, Infant Mortality over time, Doctor Numbers etc
https://docs.google.com/spreadsheets/d/1Er-leL71oawuGQHRLK_KbyESzwzcPkn4dvwY8Qec1FU/edit?usp=sharing
Monday, April 13, 2015
Tuesday, March 24, 2015
Holiday work for JS Group on Climate Change
Challenges for the Planet
Describe how the world’s climate has changed over the last 8000 years.
Summarise the main external causes of climate change.
What are the main internal causes of climate change and how do they cause climate change?
Describe the ways in which humans can bring about climate change.
What are the likely negative impacts of climate change?
What are the possible positive impacts of climate change?
Draw up a star diagram to summarise the responses to climate change. Consider the different levels of response: international (global), national and local. Use the internet to help you with this section.
It is important that you complete this work. We will go through past paper questions on it at the beginning of term.
Sunday, March 15, 2015
Tuesday, February 3, 2015

Monday, February 2, 2015
Doing Analysis in Coursework
Doing Analysis in Coursework
The idea behind analysis is to take data which you have collected and try to interpret what it tells you. The best way to do this is to take a graph(s) so that the data is presented, describe what the graph shows and then attempt to give reasons as to why the graph shows what it does. In this latter part you might refer to theory or process, for example, longshore drift.
Example
The Impact of Longshore Drift on Beach Profiles
Figure 8 Beach Transect 1
Figure 8 shows the beach profile of three transects which are shown on the map in the introduction. {puts the transects in context} The profiles are relatively shallow, however, gradient changes at -4 and at 5 metres on Transect 1 inland reflecting the change in slope. Transect 3 shows a build-up of sediment against the groyne giving the profile a slightly convex shape. {description} 
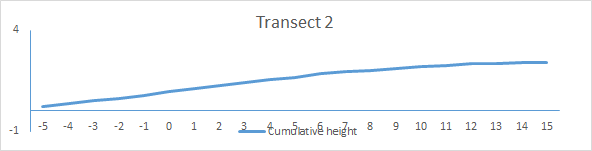

Given the location of the transects along the beach on the up-drift side of the groyne, these profiles are consistent with what would be expected as longshore drift is operating in a north-east to south-west direction on this stretch of beach. At transect 3 the convex shape is a result of sediment becoming trapped by the groyne and this is clearly shown in the photograph below.

Sunday, February 1, 2015
Guidelines and Advice for your coursework
Presentation
- material can consist of graphs, photos, maps anything that helps communicate your ideas
- make sure that you have more material than you think you need for the analysis
- use a variety of methods of presentation
- always annotate and refer to photos
Analysis
- formulate three or four sub-headings possibly in the form of questions
- present your findings using graphs, photos, sketches
- describe what they show
- try and offer explanations or reasons
- remember your results may not fit what you expect
- if this is the case, no problem, but offer reasons to explain why
- they may be partial or inconclusive
- refer to possible explanations from secondary sources eg. the World, new developments along the beach
Wednesday, January 28, 2015
Thursday, January 8, 2015
L'Aguila EQ 2009 & Haiti EQ 2010
L'Aguila 2009 vs Haiti 2010
Starting with Youtube spend some time watching some videos. Firstly just to get a feel for the two events.
The EFFECTS of these two EQ's are easy to compare. Facts and figures etc. As you watch note down any glaringly obvious statistics that are easily comparable.
You MUST be able to compare the post event management. Both Short and Long Term.
Youtube
Search "Haiti earthquake 2010 news"
Search "l'aguila earthquake news"
The following websites can give you "textbook style" facts and figures. Although they lack the visual impact of youtube they are still very good sources of information
http://www.radicalgeography.co.uk/laquilasum.pdf
http://quizlet.com/23907717/earthquake-case-study-laquila-flash-cards/
http://www.cram.com/flashcards/earthquake-in-laquila-case-study-4615645
https://ibgeography-lancaster.wikispaces.com/file/view/lquila-text-sources.pdf
Responses (& Predicting EQ's - a success story?????)
Sample Exam Questions
With reference to two seismic events that you have studied compare the ways in which earthquakes and their impacts have been managed
Evaluate the management strategies adopted following one earthquake you have studied
With reference to examples discuss the ways which seismic hazards can be managed
Subscribe to:
Comments (Atom)